Home
Welcome: TestUser
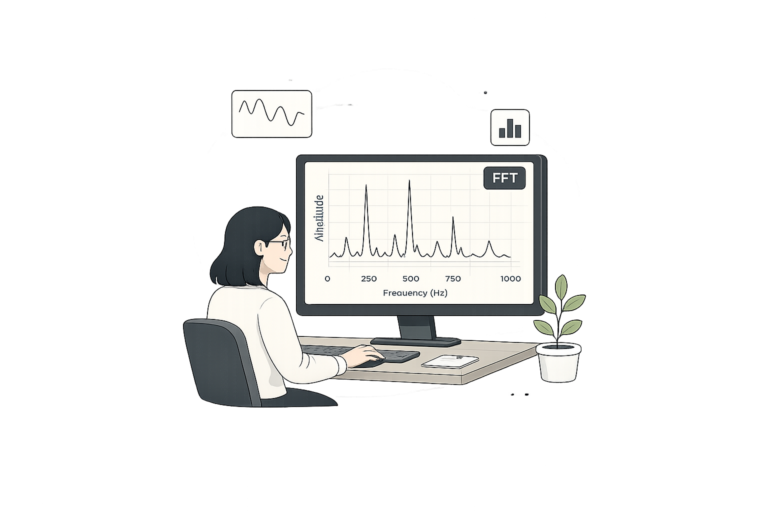
Spectrum Estimation
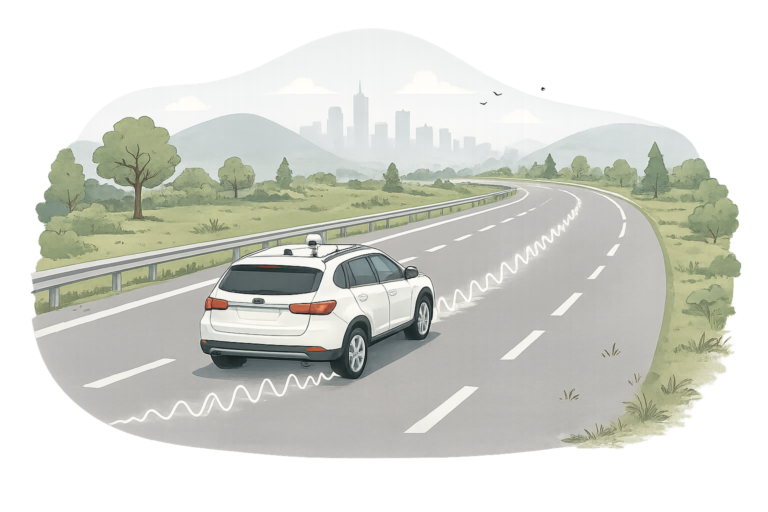
Road Profiling
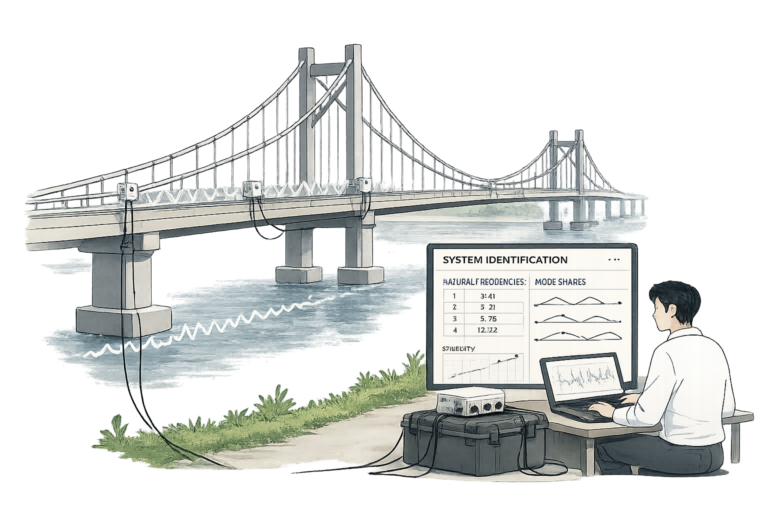
System Identification
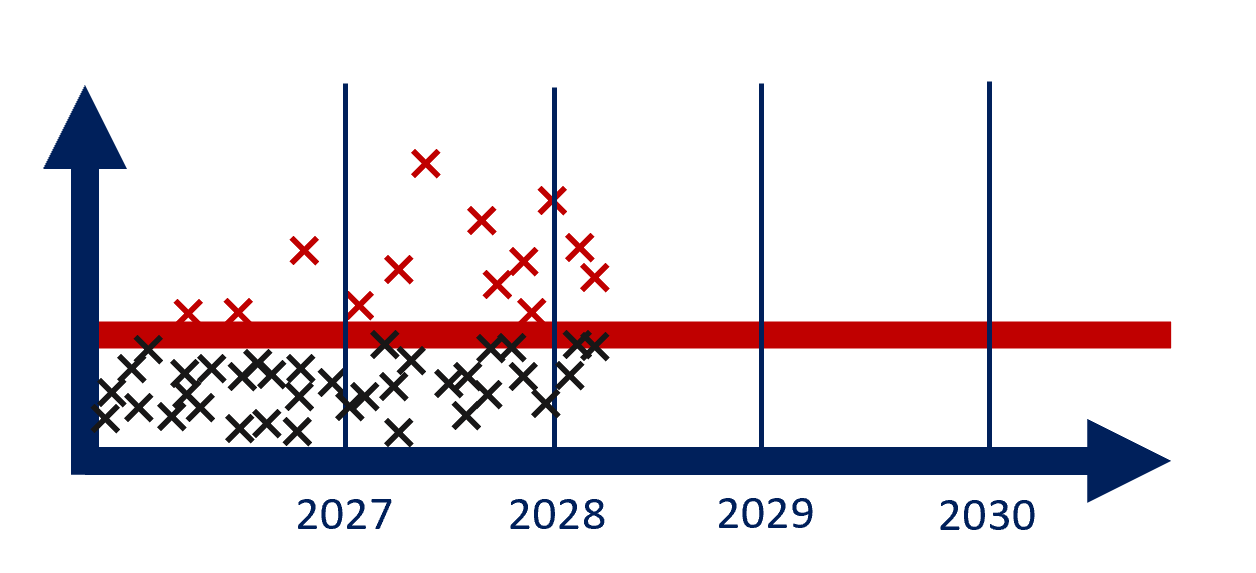
Coming Soon
SAFE